
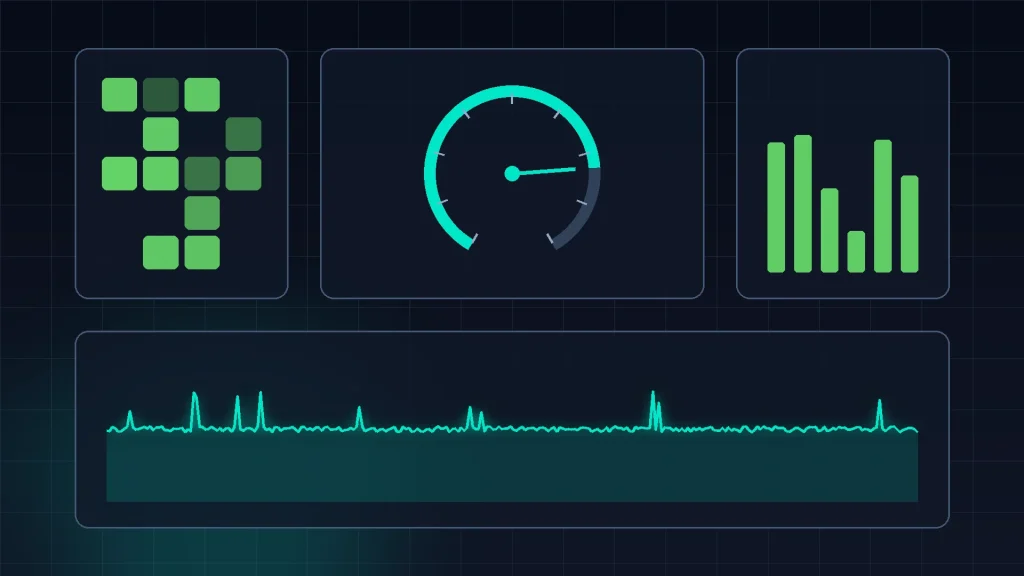
The console build of presentmon is powerful, but plenty of players just want to see their FPS and frame times on screen while they play. That is exactly what the presentmon overlay in the 2.x app was made for. Intel rebuilt the tool into a friendlier application with an in-game graphical overlay, so you get real-time performance stats without a command prompt anywhere in sight.
This guide covers what the overlay shows, how to turn it on, and how to shape it so it informs you without cluttering your screen.
What the Overlay Shows You
The overlay draws your key performance numbers directly over the game, updated in real time. The headline stats are the ones that actually describe how a game feels:
- FPS: your current frame rate, the number everyone knows.
- Frame time: the milliseconds each frame takes, which reveals smoothness far better than FPS alone. A steady 16.7 ms at 60 FPS feels great; a frame time that jumps around feels rough at any average.
- GPU busy: how hard your graphics card is working on each frame. When GPU busy nearly equals frame time, your GPU is the limit.
- Render latency: the delay in the rendering pipeline, a big part of how responsive the game feels to your inputs.
Because the overlay is powered by the same capture service as the console tool, the numbers come from real per-frame data collected through Windows ETW, not from a rough guess. That matters when you are deciding if a settings change genuinely helped.
How to Enable the Overlay
Getting it running takes a few minutes. Install the PresentMon 2.x app from Intel or the official GitHub releases, then launch it. On first run the app introduces its capture service, the background component that collects frame data and feeds both the overlay and any captures you record.
From there, the typical flow looks like this:
- Open the app and find the overlay section in its settings.
- Turn the overlay on, and choose its screen position. A corner is standard; top-left and top-right keep it clear of most HUD elements.
- Pick which stats to display. Start with FPS, frame time and GPU busy; you can add more later.
- Set a hotkey to show and hide the overlay, so you can toggle it mid-game without alt-tabbing.
- Launch your game. The overlay should appear once the game starts presenting frames.
One inherited rule still applies: capture needs proper permissions. If the overlay never appears or shows no data, run the app with administrator rights, since the underlying ETW capture depends on them, the same as the console build.
Customizing the Overlay to Your Taste
An overlay you leave on all the time has to earn its screen space. Tailor it in three ways. First, size and opacity: a smaller, slightly transparent overlay gives you the numbers at a glance without shouting over the game. Second, update behavior: real-time updates are great for spotting spikes as they happen, but if the flickering numbers distract you, a slightly slower refresh reads calmer while still catching problems.
Third, choose stats with intent. If you are tuning for smoothness, frame time is your main number and FPS is secondary. If you are chasing input responsiveness, keep render latency visible. If you suspect a CPU bottleneck, watch how frame time behaves next to GPU busy: high frame time with low GPU busy points at the CPU or the game engine, not your graphics card.
Also think per game. A competitive shooter might get a minimal overlay in a corner, just FPS and frame time. A single-player game you are tuning for a stable 60 might show the full set. Save yourself the fiddling by setting it up once per style of game you play.
Visibility deserves a thought, too. A stat block that reads clearly in a dark dungeon can vanish against a bright sky or a snowy map. If your overlay offers color choices, pick something with strong contrast against varied scenes (bright cyan or green on a dark backing panel is the classic solution) and keep the backing slightly shaded instead of fully transparent. You want a glance to be enough: looking at the overlay should never cost you more attention than the spike it just warned you about.
Overlay vs the Console Tool
The overlay and the console build are not rivals; they answer different questions. The overlay is for the moment: live stats while you play, instant feedback when a scene gets heavy, quick confirmation that your tweaks worked. The console tool is for the record: CSV files, percentiles, frame time graphs and comparisons across drivers or hardware.
Many users run both. You play with the overlay on, notice a section of a game that feels choppy, then switch to a console capture of that exact section to get the full data. The overlay tells you where to look; the console tells you precisely what happened. And since the same engine sits underneath, the numbers agree with each other.
It is also worth knowing the overlay plays well in an ecosystem. NVIDIA FrameView is built on PresentMon technology and CapFrameX uses the same capture service, so if you have used those, the stats here will feel familiar and consistent.
Troubleshooting Overlay Issues
If the overlay does not show up, work through the usual suspects. Confirm the game is actually running in a mode the capture can see, and try a borderless or windowed mode if exclusive fullscreen hides it. Check that no other overlay tool is fighting for the same space, since tools like RTSS can conflict. Make sure the capture service is running and the app has admin rights. Finally, verify you are targeting a DirectX 9, 10, 11, 12, OpenGL or Vulkan title, which are the APIs the tool supports.
Using the Overlay While You Tune Settings
The overlay earns its keep most when you are actively tuning a game. Instead of changing five settings, playing for ten minutes and guessing, you change one setting and watch the frame time readout react in the exact scene that troubled you.
A practical tuning session goes like this. Stand in the area where performance dips (a busy city square, a dense forest, a effects-heavy fight) and note your frame time and GPU busy figures. Lower one demanding setting, such as shadows or volumetric quality, and watch the same spot. If GPU busy drops and frame time steadies, that setting was your problem. If nothing moves, restore it and try the next candidate. Ten minutes of this beats an evening of random preset swapping.
The overlay also settles the frame cap question. Many players cap their frame rate a little below their monitor’s refresh rate for steadier pacing. With frame time visible, you can see the effect immediately: an uncapped run that swings between 7 ms and 14 ms often feels worse than a capped run holding a flat 8.3 ms. The graph in your head becomes obvious when the number stops jumping.
Watch render latency during this process as well. Some settings and cap choices trade a little smoothness for responsiveness or the other way around. The right balance depends on the game and on you, and the overlay gives you both numbers at once so the trade is a decision, not a guess.
Conclusion
The presentmon overlay brings the tool’s trusted frame data into your game in real time. Turn it on in the 2.x app, keep FPS, frame time, GPU busy and render latency in view, and trim the display down to what you actually read. You will spot stutter the moment it happens, see at a glance if the GPU or the CPU is the bottleneck, and make settings changes with confidence instead of vibes.
Read next: