
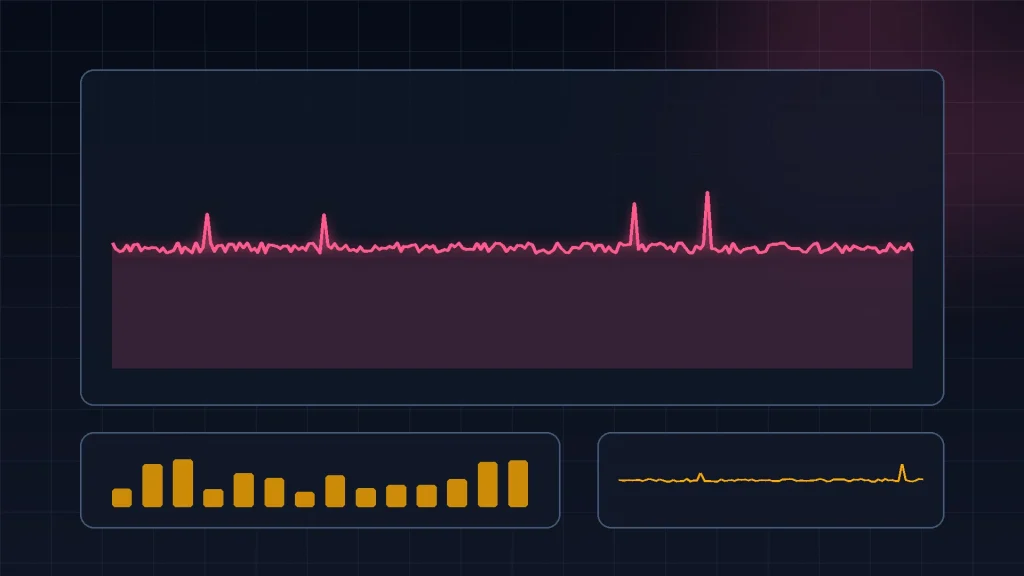
Anyone can quote an average FPS number. A proper benchmark tells you how a game actually performs: how smooth it feels, where it struggles, and whether a change you made truly helped. That is why serious reviewers benchmark games with presentmon. It captures every frame through Windows ETW and gives you frame time data you can compare fairly across runs, settings and hardware.
This guide lays out a repeatable benchmarking method you can use at home, the same basic approach the big review sites rely on.
What Makes a Benchmark Trustworthy
A benchmark is only useful if running it twice gives you the same answer. Three things decide that: a fixed test scene, fixed conditions, and data that goes deeper than average FPS.
Fixed scene means you test the same stretch of gameplay every time. A built-in benchmark mode is ideal when a game has one. Otherwise, pick a route you can repeat: the same run through a level, the same drive across a map, the same fight. Fixed conditions mean same resolution, same settings, same driver, same background apps (ideally none). And deep data means frame times, percentiles and 1% lows, because those are the figures that describe smoothness.
Setting Up Your Test
Before the first capture, prepare your system:
- Update and note your driver version. Record it in your file names or notes, since driver changes are a variable you will want to track.
- Close background apps and other overlays. Browsers, launchers updating games and overlay tools all add noise or conflict with capture.
- Warm the game up. Play for a few minutes first. Modern games compile shaders as new areas load, and those one-time spikes will pollute a cold capture.
- Fix your settings. Choose the resolution and preset you are testing and leave them untouched for the whole comparison.
Run presentmon as administrator, always. Its ETW capture needs the rights, and a benchmark ruined by an empty file is a benchmark you have to run again.
Running the Capture
Target the game and give the capture a fixed length. A command along these lines handles most tests:
PresentMon.exe -process_name yourgame.exe -output_file game_high_1.csv -delay 5 -timed 60
The delay lets you get back into the game and into position. Sixty seconds of a repeatable scene is a solid standard run; demanding open-world routes sometimes justify two minutes. Run the exact same test at least twice, ideally three times, and keep every file. If the runs disagree wildly, something in your conditions moved, and finding out what is part of the job.
Name files so the test explains itself: game, settings level, run number, date. Future comparisons are painless when the folder reads like a lab notebook.
The Metrics That Matter
When you open your captures, rank the metrics like this:
- Average FPS: still useful as the headline, but never the whole story.
- 99th percentile frame time / 1% lows: the smoothness score. It describes the worst one percent of frames, the moments you feel as hitches. A setup can win on average FPS and lose badly here.
- Frame time graph: plot MsBetweenPresents over time. A flat line is smooth; spikes are stutters; a rising line means performance degrades as the scene heats up.
- Dropped frames: frames rendered but never displayed. Clusters of them pinpoint the exact scenes that break pacing.
- CPU vs GPU busy: tells you which component is the ceiling. GPU busy matching frame time means the graphics card is the limit; low GPU busy with poor frame times points at the CPU.
Comparing Settings, Drivers and Hardware
This method shines when you change exactly one thing at a time. Benchmark at high settings, then rerun the identical route at medium. Update your driver, rerun, compare. Swap a component, rerun, compare. Because the scene and capture length never change, any difference in the frame time data belongs to the thing you changed.
Present the comparison honestly: averages and 1% lows side by side, plus the frame time graph for each run. That is the format reviewers use, and once you have seen a “faster on average, worse in the lows” result with your own eyes, you will understand why they insist on it.
Common Benchmarking Mistakes
Watch out for the classics. Testing different scenes between runs makes comparisons meaningless. Capturing during shader compilation or a first-ever load skews results. Leaving a frame rate cap or VSync state inconsistent between runs changes the thing you are measuring. And reporting one lucky run instead of the pattern across repeats is how bad conclusions get published.
A Sample Benchmark Session, Start to Finish
Here is the whole method applied to one realistic question: did the new graphics driver actually improve your favorite game?
You start on the old driver. After warming the game up for a few minutes, you run your fixed route three times with 60-second timed captures, and name the files with the game, the settings and the old driver version. From the CSVs you pull the same three numbers each time: average FPS, the 99th percentile frame time, and a frame time graph. Say the game averages 92 FPS with a 99th percentile of 21 ms, and the graph shows regular spikes in the market district part of your route.
Then you install the new driver and change nothing else. Same settings, same route, same capture length, three more runs. This time the average is 94 FPS, close enough to be uninteresting, but the 99th percentile drops to 15 ms and the market district spikes are visibly shorter on the graph. That is a real improvement where it counts, in the worst moments, and you can say so with evidence instead of “it feels smoother, I think”.
If the numbers had gone the other way, you would have learned something equally valuable, and rolling back the driver would be an easy call. Notice what made the conclusion solid: one change at a time, repeated runs, and smoothness metrics next to the average. Remove any of those and you are back to guessing.
Keep a small results log as you go, even a plain text file with the date, the change you tested, and the headline numbers. Three months and several tests later, that log is the difference between remembering your PC’s history and re-running tests you already did.
Save the frame time graph from each session alongside the numbers, too. Averages and percentiles compress a run into figures, but the graph keeps the shape of the experience: where the spikes clustered, whether performance sagged late in the run, how consistent the pacing really was. When you compare two setups weeks apart, glancing at two graphs side by side tells you in seconds what a table of numbers takes a minute to say. Reviewers publish graphs for exactly this reason, and your own testing deserves the same clarity. Your future self, mid-upgrade and wondering if the money helped, will be grateful you kept them.
Conclusion
Benchmarking games with presentmon is a discipline, not a button press: fix the scene, fix the conditions, capture with a timed command, and judge by frame times and 1% lows instead of averages alone. Do that, and your results will stand up to repeat runs and honest scrutiny. You will know exactly what a settings change, a driver or a new GPU really bought you, measured in the smoothness you can feel.
Read next:
Pingback: How to Read PresentMon CSV Files and Frame Time Data