
Average FPS is a blunt instrument. It can tell you a game ran at 100 frames per second while hiding the hitches and spikes that made it feel rough. When you use presentmon to measure your games, you capture every frame with its exact timing, so smoothness becomes something you can see and prove. This guide takes you through a complete first capture, from launching the tool to reading the numbers it gives you.
You do not need to be a benchmarking expert. If you can run a game and type one command, you can do everything below.
Before You Start: The Two-Minute Checklist
A clean capture starts before the tool even opens. Run through these points first:
- Run presentmon as administrator. It reads frame events through Windows ETW, and ETW capture needs admin rights. Without them you will get errors or an empty result.
- Close other overlays. Tools like RTSS and other FPS overlays can conflict or add their own effects. Shut down anything you are not testing.
- Find your game’s process name. Open Task Manager while the game runs and note the exact exe name on the Details tab. You will target the capture with it.
- Decide what you are testing. A specific scene, a settings change, a new driver. One question per capture keeps your results meaningful.
Your First Capture, Step by Step
Start your game and load into the scene you want to measure. Then open a terminal in the folder where PresentMon.exe lives (or double-click it if you set it to run as administrator earlier) and use a command like this:
PresentMon.exe -process_name yourgame.exe -output_file capture1.csv -timed 60
Here is what each part does. The -process_name flag tells presentmon to record only that game, ignoring your desktop and other apps. The -output_file flag saves every frame to a CSV file you can open later. The -timed 60 flag stops the capture automatically after 60 seconds, which is a good length for a repeatable test run.
Play normally while it captures. Walk the same route, fight the same enemies, or let the same benchmark scene play out. When the timer ends, the console closes the file and you have your data. While a capture runs, the console window also shows live figures, including average FPS and frame time percentiles, so you get a quick read even before opening the CSV.
If you prefer manual control, leave out -timed and use the capture hotkey (F11 by default in classic builds) to start and stop recording, or simply close the console when you are done. The -delay flag helps here too: it waits a set number of seconds before capturing starts, giving you time to alt-tab back into the game.
Reading the Numbers That Matter
Open your CSV in a spreadsheet and you will see one row per frame. Do not panic at the number of columns; a few carry most of the meaning:
- MsBetweenPresents: the frame time, the milliseconds between frames. This is the heart of the data. Around 16.7 ms means 60 FPS, 8.3 ms means 120 FPS and 6.9 ms means 144 FPS.
- Dropped: marks frames that were rendered but never displayed. A cluster of dropped frames lines up exactly with the stutters you feel.
- Runtime: shows which graphics API the game used, such as DX11, DX12, GL or VK.
- MsUntilDisplayed and MsInPresentAPI: timing details that help explain latency and where time went inside each frame.
The live console summary adds the most useful single figure: the 99th percentile frame time. Think of it as your “1% lows” style smoothness score. If your average frame time is 10 ms (100 FPS) but the 99th percentile sits at 25 ms, the worst one percent of frames felt like a 40 FPS game. That gap between average and percentile is where stutter lives.
How to Read a Frame Time Graph
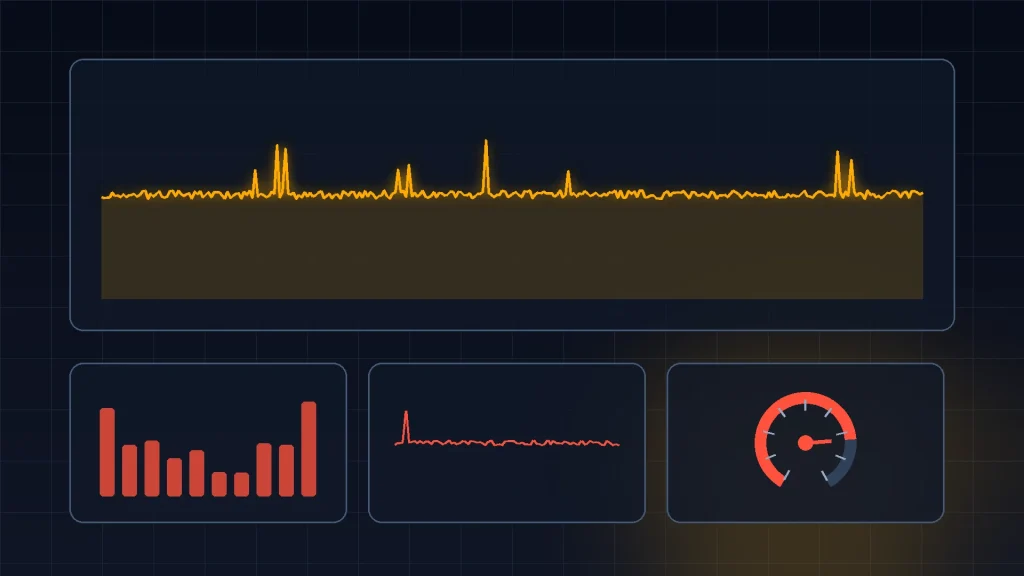
If you plot MsBetweenPresents as a line graph, you get the picture reviewers love. A flat, low line means a smooth game: every frame arrived on schedule. Spikes are frames that took far longer than their neighbors, and each tall spike is a hitch you would have felt. A line that wobbles constantly means inconsistent pacing, which often feels worse than a slightly lower but steady frame rate.
This is why presentmon changed benchmarking. Two GPUs can tie on average FPS while one draws a calm flat line and the other looks like a mountain range. Your eyes notice the mountains.
Tips for Captures You Can Trust
Consistency is everything. Capture the same scene, for the same length of time, with the same settings, and repeat each test at least twice. Let your PC warm up first, since shader compilation in the first minutes of a session creates spikes that will not appear later. Note your driver version and settings next to each file name. Small habits like these separate a useful benchmark from a folder of confusing spreadsheets.
Repetition has a second benefit: it teaches you what normal variation looks like. Run the identical capture three times and you will see averages wobble by a frame or two and percentiles shift slightly. That wobble is your margin of error. Once you know it, you stop chasing ghosts (a one FPS “drop” after a driver update is usually just noise) and you start recognizing real changes when the numbers move well past it. Every confident conclusion in benchmarking rests on that simple calibration.
Capturing the Right Moments
What you choose to record matters as much as how you record it. A capture is a sample of gameplay, and a lazy sample gives you lazy answers. Think about which moments represent the experience you care about, and aim the tool at those.
Menus, loading screens and cutscenes pollute data fast. Menus often run uncapped or locked to odd rates, loading screens produce long strings of dropped or stalled frames, and cutscenes may run at a fixed 30 FPS by design. None of that tells you how gameplay performs. Use the -delay flag or the F11 capture hotkey to start recording when the action starts, and stop before you tab back out to menus.
Pick scenes with intent. If a game stutters in busy cities but runs fine in empty fields, capture the city. If a specific fight tanks your frame rate, capture that fight twice: once as your baseline and once after any tweak. A capture that mixes five different areas into one average is hard to learn from, because the number describes a place that does not exist.
Watch out for focus, too. The capture follows the process you named, and if you alt-tab to a browser mid-run, your desktop apps can sneak frames into an untargeted capture or your game can pause and produce a flat stretch of nothing. Stay in the game for the full timed window. It sounds obvious, yet it ruins more home benchmarks than any technical fault.
Finally, capture longer than you think you need. Ten seconds can catch a lucky or unlucky patch of gameplay. Sixty seconds of a representative scene smooths out the noise and gives percentiles that mean something.
Conclusion
Using presentmon comes down to a simple loop: target your game with -process_name, capture a set stretch of gameplay with -timed, then read the frame times instead of trusting the average. Watch MsBetweenPresents, the 99th percentile and dropped frames, and you will know exactly how smooth a game really is on your system. After a couple of runs it becomes second nature, and every driver update or settings tweak becomes a question you can answer with data.
Read next:
Pingback: PresentMon Console Commands and Flags Explained
Pingback: PresentMon Overlay Guide: How to Enable and Customize
Pingback: How to Benchmark Games with PresentMon Properly