
You have probably seen the FPS counter in the corner of a game and wondered if that single number tells the whole story. It does not. A game can report 90 frames per second and still feel stuttery, because what you actually feel is how evenly those frames arrive. That is exactly the gap presentmon was built to close. It is a free, open-source performance tool from Intel that records the timing of every single frame a game produces, so you can see smoothness with real data instead of guessing from an average.
In this guide you will learn what presentmon measures, how it captures that data, who uses it, and what you need to run it. By the end, you will understand why reviewers and benchmarkers treat it as the ground truth for gaming performance.
What PresentMon Actually Measures
Most FPS tools sample your frame rate once or twice a second and show you an average. PresentMon works at a much deeper level. It records every frame individually, along with a set of timings that describe how that frame moved through your system. The core numbers include:
- Frame time: the milliseconds between one presented frame and the next, often written as MsBetweenPresents in the data. Lower and steadier is better.
- FPS: frames per second, which is simply the inverse of frame time. A frame time of 16.7 ms works out to 60 FPS, 8.3 ms is 120 FPS, and 6.9 ms is 144 FPS.
- CPU busy and CPU wait: how long the processor spent working on a frame, and how long it sat idle waiting for something else.
- GPU busy and GPU wait: the same pair of measurements for your graphics card, which tells you if the GPU is the bottleneck.
- Display latency: the delay between a frame finishing and it actually appearing on your screen.
- Dropped frames: frames that were rendered but never made it to the display.
Because you get every frame, you can calculate things an average hides. The big one is percentiles. The 99th percentile frame time, often discussed as the “1% low” style smoothness figure, shows how bad the worst moments get. Two games can both average 100 FPS while one has ugly spikes that you feel as hitches. PresentMon exposes those spikes immediately.
How PresentMon Captures Frame Data
PresentMon does not hook into your game the way many overlays do. It listens to Windows itself, using ETW (Event Tracing for Windows), the built-in diagnostics system that logs presentation events from the graphics stack. When a game presents a frame, Windows records it, and presentmon reads that stream and turns it into numbers.
This design has real advantages. It works with DirectX 9, 10, 11 and 12 games, plus OpenGL and Vulkan titles, and it does not care which GPU you own. Intel, AMD and NVIDIA cards all work the same way. It also means the tool adds very little overhead of its own, which matters when you are trying to measure performance honestly.
The trade-off is permissions. ETW capture needs administrator rights, so you have to run presentmon as administrator or it will fail to start or capture nothing. That is the single most common beginner mistake, and it is an easy one to fix.
Console App vs the PresentMon 2.x Overlay
There are two flavors of the tool, and they suit different people. The classic build is a console app, PresentMon.exe, a single file you run from a command prompt or terminal. While it runs, the console window shows live average FPS, frame time percentiles and CPU and GPU times, and it can save everything to a CSV file for later analysis. This is the version benchmarkers have used for years because it is scriptable, precise and transparent.
PresentMon 2.x added Intel’s PresentMon app, which includes an in-game graphical overlay and a capture service. The overlay shows real-time FPS, frame time, GPU busy and render latency while you play, aimed at regular gamers who want the numbers without touching a command line. Under the hood, the same capture technology does the work. If you just want to watch your stats live, the overlay app is friendlier. If you want data files you can graph and compare, the console build is still the tool to learn.
The tech is also bigger than the name suggests. NVIDIA FrameView is built on PresentMon technology, and CapFrameX uses its capture service, so a huge share of the frame time numbers you see in reviews trace back to this one open-source project.
Who Uses PresentMon and Why
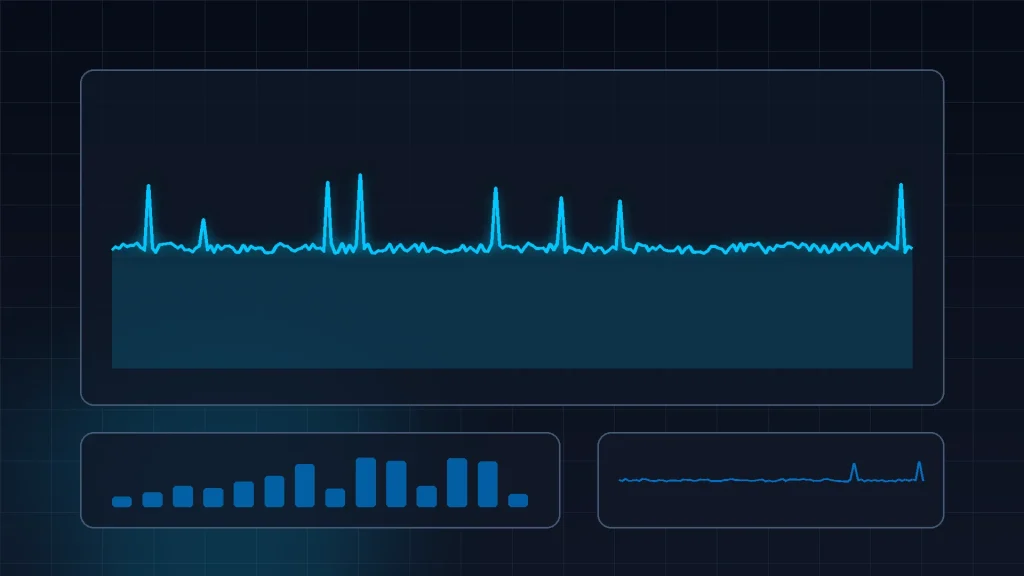
Hardware reviewers use presentmon because average FPS charts are easy to game and hard to trust. Frame time data shows whether a GPU delivers a smooth experience or a fast but jerky one, and tech sites have built their benchmarking around it. If you have ever seen a frame time graph in a review, a mostly flat line with occasional spikes, that data almost certainly came from this tool or something built on it.
Regular players get plenty out of it too. You can check if a new driver actually improved smoothness, if a settings change removed your stutter, or if your CPU is holding back your GPU. Instead of arguing from feel, you capture a run before and after the change and compare the numbers. Developers and support teams use it the same way, to prove where a performance problem lives.
What You Need to Run It
The requirements are light. You need Windows 10 or Windows 11 in 64-bit, administrator rights for the capture, and any modern GPU from any brand. The console build needs no installation at all: you download the single exe and run it. The official sources are Intel’s PresentMon page and the project releases on GitHub, where the source code is public under the GameTechDev organization.
One behavior worth knowing before you start: a flat frame time line means a smooth game, and spikes mean stutter, even when the average FPS looks healthy. Once you start reading frame times instead of averages, you will never look at an FPS counter the same way again.
What a Real Capture Looks Like
It helps to picture an actual session. You launch your game, alt-tab to a terminal, and start presentmon with your game targeted. The console window wakes up and begins reporting live figures: an average FPS that updates as you play, a frame time readout, and percentile values that creep up or settle down depending on the scene. You play for a minute, stop the capture, and open the CSV file it saved.
Inside, every row is one frame. Scrolling through the frame time column, you see a steady run of values around 8 ms while you explore a quiet area, which is a healthy 120 FPS pace. Then, right where an explosion filled the screen, a cluster of 20 ms and 30 ms rows appears. That cluster is the stutter you felt, captured and timestamped. Nothing about the average FPS warned you it was coming, but the frame data shows it plainly.
That little moment is the whole point of the tool. It turns a vague feeling (“this fight felt choppy”) into evidence you can point at, compare after a patch, and share with other players who run the same scene.
Conclusion
PresentMon is the tool that turned “the game feels smooth” into something you can measure. It captures every frame through Windows ETW, works across DirectX, OpenGL and Vulkan on any GPU, and gives you frame times, CPU and GPU timings, display latency and dropped frames in a form you can analyze. Grab the console build for serious benchmarking or the 2.x app for a live overlay; either way, you are getting the same trusted engine that powers big-name tools like FrameView and CapFrameX. Start with a download and a first capture, and you will quickly see what your FPS counter has been hiding.
Read next:
Pingback: PresentMon vs CapFrameX: Which Should You Use?
Pingback: PresentMon System Requirements and Supported APIs